Monday, 18 May 2020
Creating a Health Check in GCP Compute
Create a health check
```
gcloud compute health-checks create http autohealer-check \
--check-interval 10 \
--timeout 5 \
--healthy-threshold 2 \
--unhealthy-threshold 3 \
--request-path "/health"
```
Create a firewall rule to allow health check probes to make HTTP requests
```
gcloud compute firewall-rules create default-allow-http-health-check \
--network default \
--allow tcp:80 \
--source-ranges 130.211.0.0/22,35.191.0.0/16
```
Pro Tip: Use separate health checks for load balancing and for autohealing. Health checks for load balancing detect unresponsive instances and direct traffic away from them. Health checks for autohealing detect and recreate failed instances, so they should be less aggressive than load balancing health checks. Using the same health check for these services would remove the distinction between unresponsive instances and failed instances, causing unnecessary latency and unavailability for your users.

Sunday, 10 May 2020
Getting Started with Kubernetes Engine
## Objectives
- Provision a Kubernetes cluster using Kubernetes Engine.
- Deploy and manage Docker containers using kubectl.
## Prerequisites
- Existing GCP Project
- Kubernetes Engine API and Google Container Registry API have been enabled
## Start a Kubernetes Engine cluster
In GCP console, on the top right toolbar, click the Open Cloud Shell button.
Click Continue.
Place the zone into an environment variable called MY_ZONE. At the Cloud Shell prompt, type this partial command:
```
export MY_ZONE=us-central1-a
```
Start a Kubernetes cluster managed by Kubernetes Engine. Name the cluster ``webfrontend`` and configure it to run ``2`` nodes:
```
gcloud container clusters create webfrontend --zone $MY_ZONE --num-nodes 2
```
It takes several minutes to create a cluster as Kubernetes Engine provisions virtual machines for you.
```
NAME LOCATION MASTER_VERSION MASTER_IP MACHINE_TYPE NODE_VERSION NUM_NODES STATUS
webfrontend us-central1-a 1.14.10-gke.27 35.223.99.22 n1-standard-1 1.14.10-gke.27 2 RUNNING
```
After the cluster is created, check your installed version of Kubernetes using the ``kubectl version`` command:
kubectl version
The ``gcloud container clusters create`` command automatically authenticated kubectl for you.
```
kubectl version
```
```
Client Version: version.Info{Major:"1", Minor:"14+", GitVersion:"v1.14.10-dispatcher", GitCommit:"f5757a1dee5a89cc5e29cd7159076648bf21a02b", GitTreeState:"clean", BuildDate:"2020-02
-06T03:29:33Z", GoVersion:"go1.12.12b4", Compiler:"gc", Platform:"linux/amd64"}
Server Version: version.Info{Major:"1", Minor:"14+", GitVersion:"v1.14.10-gke.27", GitCommit:"145f9e21a4515947d6fb10819e5a336aff1b6959", GitTreeState:"clean", BuildDate:"2020-02-21T
18:01:40Z", GoVersion:"go1.12.12b4", Compiler:"gc", Platform:"linux/amd64"}
```
View your running nodes in the GCP Console. On the Navigation menu (Navigation menu), click Compute Engine > VM Instances. Your Kubernetes cluster is now ready for use.

## Run and deploy a container
From your Cloud Shell prompt, launch a single instance of the nginx container. (Nginx is a popular web server.)
```
kubectl run nginx --image=nginx:1.10.0
```
In Kubernetes, all containers run in pods. This use of the kubectl run command caused Kubernetes to create a deployment consisting of a single pod containing the nginx container. A Kubernetes deployment keeps a given number of pods up and running even in the event of failures among the nodes on which they run. In this command, you launched the default number of pods, which is 1.
> Note: If you see any deprecation warning about future version you can simply ignore it for now and can proceed furthe
View the pod running the nginx container:
```
kubectl get pods
```
```
NAME READY STATUS RESTARTS AGE
nginx-fb9c7b94d-p7x4x 1/1 Running 0 2m32s
```
Expose the nginx container to the Internet:
```
kubectl expose deployment nginx --port 80 --type LoadBalancer
```
```
service/nginx exposed
```
Kubernetes created a service and an external load balancer with a public IP address attached to it. The IP address remains the same for the life of the service. Any network traffic to that public IP address is routed to pods behind the service: in this case, the nginx pod.
View the new service:
```
kubectl get services
```
```
NAME TYPE CLUSTER-IP EXTERNAL-IP PORT(S) AGE
kubernetes ClusterIP 10.51.240.1 443/TCP 5m42s
nginx LoadBalancer 10.51.242.185 80:31576/TCP 15s
```
You can use the displayed external IP address to test and contact the nginx container remotely.
It may take a few seconds before the External-IP field is populated for your service. This is normal. Just re-run the kubectl get services command every few seconds until the field is populated.
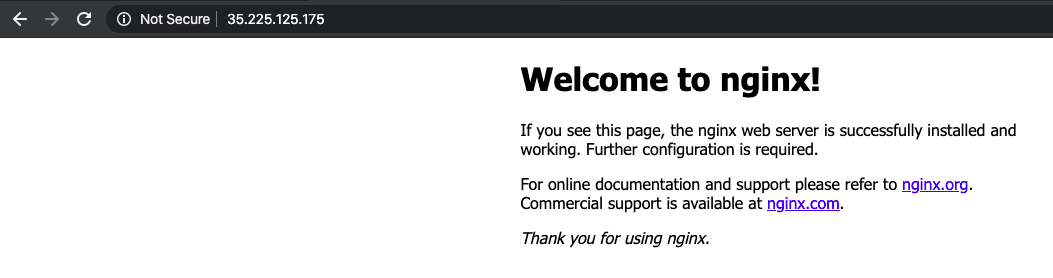
Open a new web browser tab and paste your cluster's external IP address into the address bar. The default home page of the Nginx browser is displayed.
Scale up the number of pods running on your service:
```
kubectl scale deployment nginx --replicas 3
```
```
deployment.extensions/nginx scaled
```
Scaling up a deployment is useful when you want to increase available resources for an application that is becoming more popular.
Confirm that Kubernetes has updated the number of pods:
```
kubectl get pods
```
```
NAME READY STATUS RESTARTS AGE
nginx-fb9c7b94d-p7x4x 1/1 Running 0 3m51s
nginx-fb9c7b94d-qvm4b 1/1 Running 0 18s
nginx-fb9c7b94d-sk4rm 1/1 Running 0 18s
```
Confirm that your external IP address has not changed:
```
kubectl get services
```
```
NAME TYPE CLUSTER-IP EXTERNAL-IP PORT(S) AGE
kubernetes ClusterIP 10.51.240.1 443/TCP 6m53s
nginx LoadBalancer 10.51.242.185 35.225.125.175 80:31576/TCP 86s
```
Return to the web browser tab in which you viewed your cluster's external IP address. Refresh the page to confirm that the nginx web server is still responding.
GCP Anthos 101
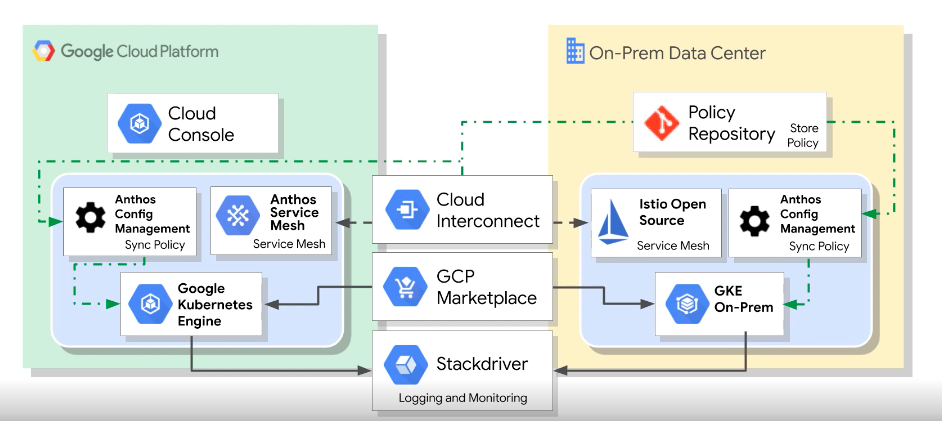
- google's modern solution for hybrid and multi-cloud systems and services management
- kubernetes and GKE on-prem create the foundation
- on-prem and cloud environments stay in sync
- a rich set of tools is provided for:
- manageing services on-prem and in the cloud
- monitoring systems and services
- migrating applications from VMs into your clusters
- maintaining consistent policies across all clusters, whether on-prem or in the cloud
Monday, 13 April 2020
Getting Started with Stackdriver
## Objectives
- View the load on a VM instance using Cloud Monitoring.
## Prerequisites
- Existing GCP Project
- Existing VM instance
## View the Load on a VM using Cloud Monitoring
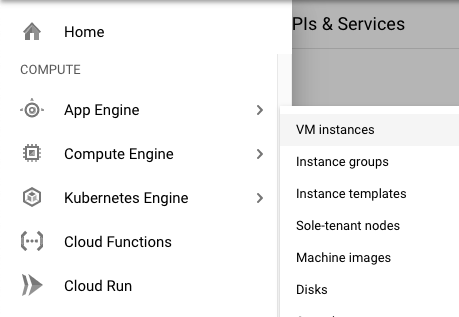
In the GCP Console, on the Navigation menu (Navigation menu), click Compute Engine > VM instances.
To open a command prompt on the my-vm instance, click SSH in its row in the VM instances list.
In the ssh session on my-vm, execute this command to create a CPU load:
```
dd if=/dev/urandom | gzip -9 >> /dev/null &
```
This Linux pipeline forces the CPU to work on compressing a continuous stream of random data.
Leave the window containing your SSH session open.
## Create a Monitoring workspace
You will now setup a Monitoring workspace that's tied to your GCP Project. The following steps create a new account that has a free trial of Monitoring.
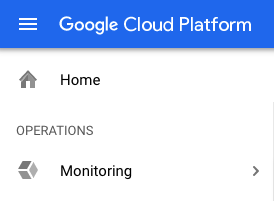
In the Google Cloud Platform Console, click on Navigation menu > Monitoring.
Wait for your workspace to be provisioned.
When the Monitoring dashboard opens, your workspace is ready.
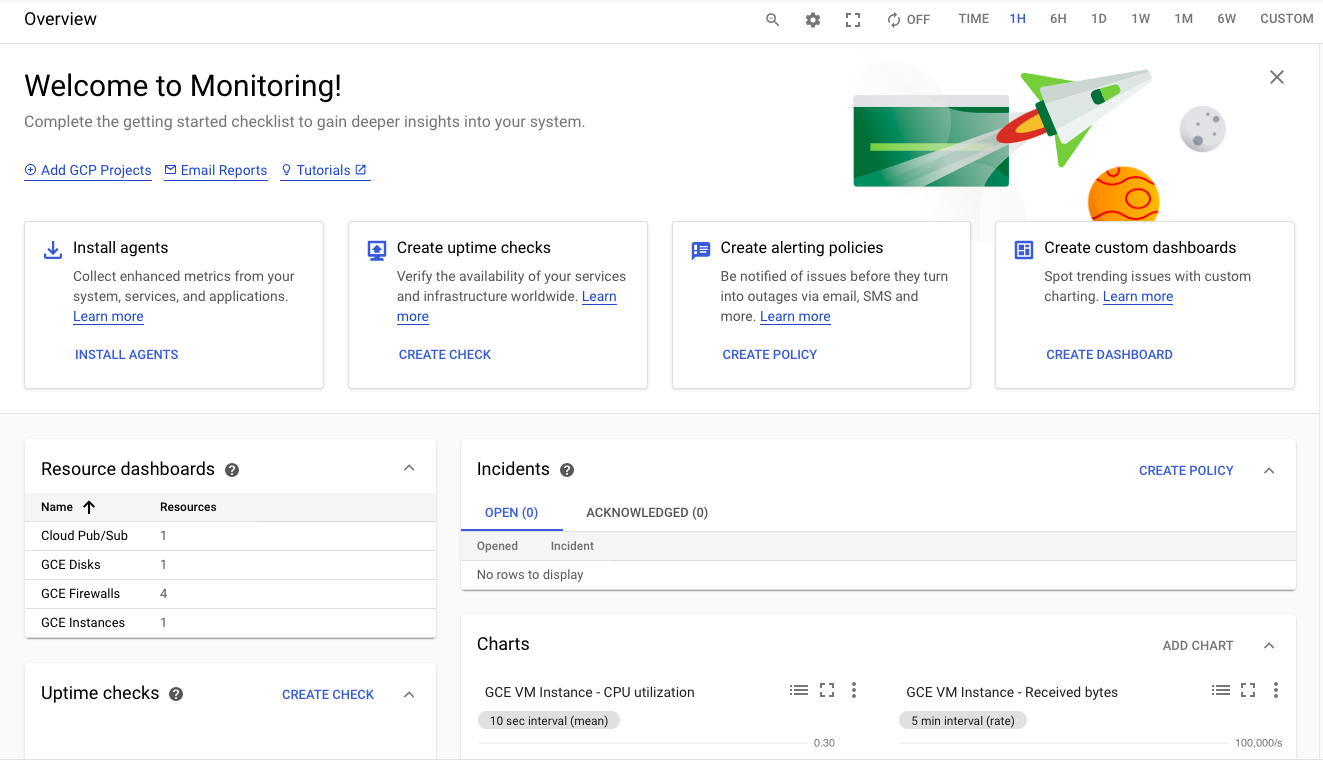
Click on Settings option from the left panel and confirm that the GCP project is shown under the GCP Projects section.
Under the Settings tab menu, click Agent. Using your VM's open SSH window and the code shown on the Agents page, install both the Monitoring and Logging agents on your project's VM.
The monitoring and logging agents give you deeper insight into your infrastructure and application data. Install both agents onto all the infrastructure you want deeper insight into.
### Monitoring agent
The Monitoring agent is a collectd-based daemon that gathers system and application metrics from virtual machine instances and sends them to Monitoring. By default, the Monitoring agent collects disk, CPU, network, and process metrics. Configuring the Monitoring agent allows third-party applications to get the full list of agent metrics.
Monitoring agent install script
```
curl -sSO https://dl.google.com/cloudagents/install-monitoring-agent.sh
sudo bash install-monitoring-agent.sh
```
### Logging Agent
The Logging agent streams logs from your VM instances and from selected third-party software packages to Logging. It is a best practice to run the Logging agent on all your VM instances.
Logging agent install script
```
curl -sSO https://dl.google.com/cloudagents/install-logging-agent.sh
sudo bash install-logging-agent.sh
```
Once both of the agents have been installed on your project's VM, click Metrics Explorer under the main Cloud Monitoring menu on the far left.
In the Metric pane of Metrics Explorer, select the resource type GCE VM instance
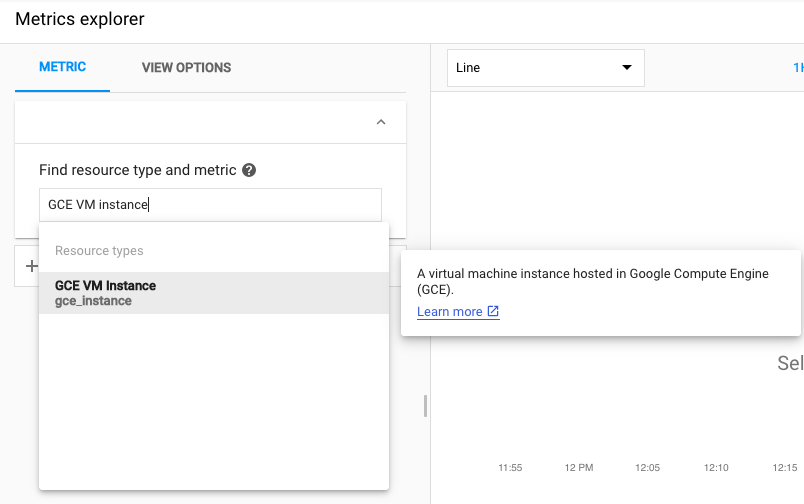
and the metric CPU usage.
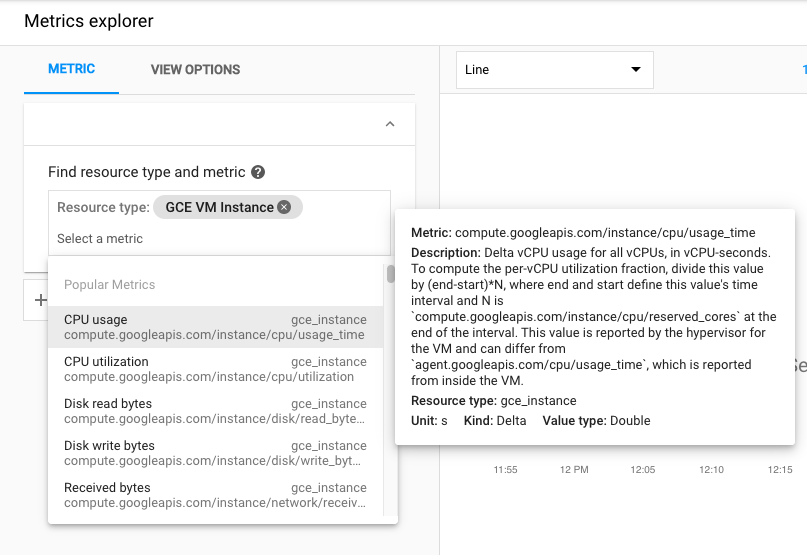
In the resulting graph, notice that CPU usage increased sharply a few minutes ago.
Terminate your workload generator. Return to your ssh session on my-vm and enter this command:
```
kill %1
```
How to choose Azure services for working with messages in your application
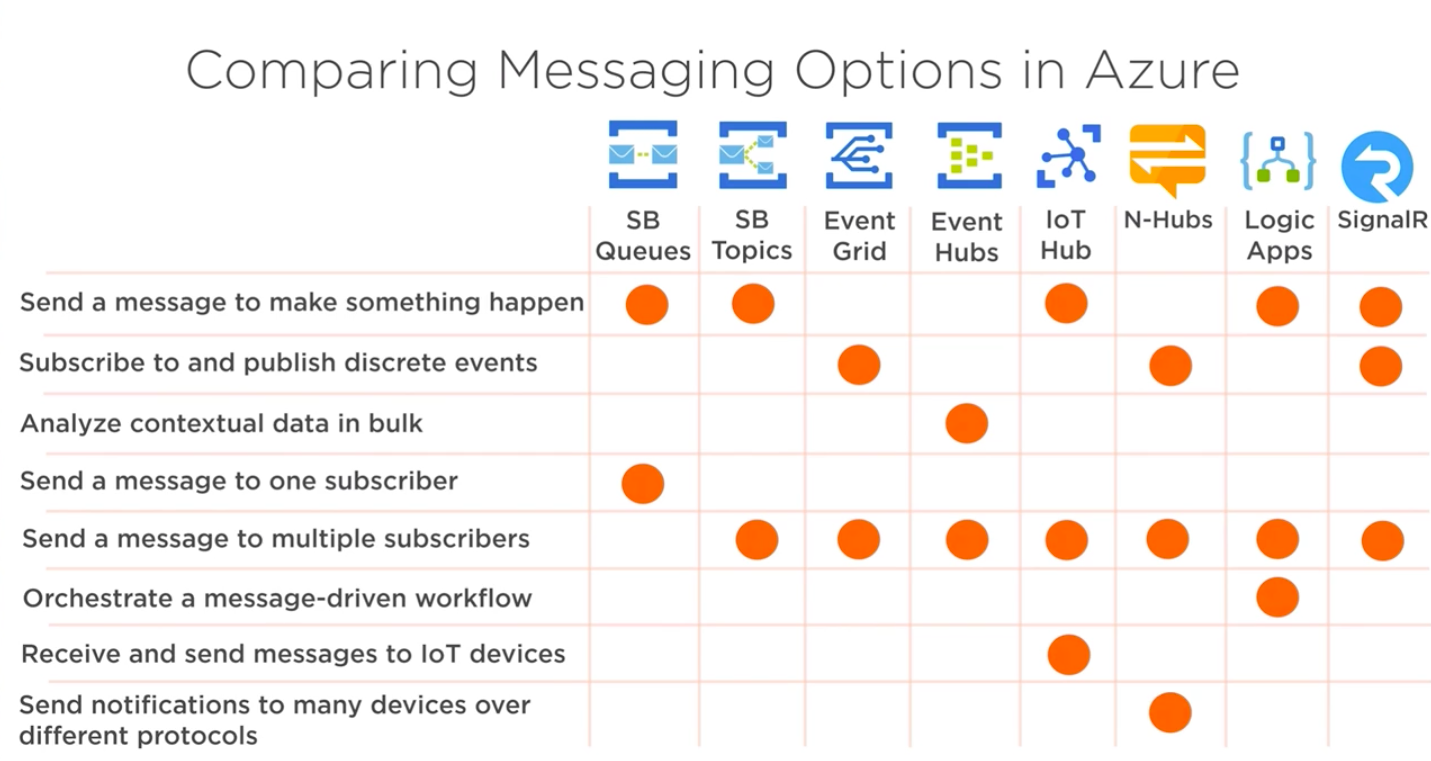
## Options for working with messages in Azure
- Azure Storage Queue
- Azure Service Bus
- Azure Notification Hubs
- Azure Event Grid
- Azure Event Hubs
- Azure IoT Hub
- Azure Logic Apps
- Azure SignalR Service
### Azure Storage Queue
- Message lifetime <= 7 days
- Queue size > 80 GB
- Transaction logs
- Message size <= 64KB
### Azure Service Bus
- Message lifetime > 7 days
- Guaranteed (FIFO) ordered
- Duplicate detection
- Message size <= 1MB>
#### Queues
Put a message on the queue and one application takes it out for processing
#### Topics
Put a message on the queue and multiple applications can take it out for processing
### Azure Notification Hubs
Put a message to send notifications to Andrioid, iOS, Windows and all sort of other platform network notification services without having to write plumbing to talk to those notification services.
### Azure Event Grid
Subscribe to events and push those events to somewhere. For example, subscribe to an event in Azure storage when Blob gets uploaded and use that event to kickoff an Azure Function to process something.
### Azure Event Hubs
Ingest massive amounts of messages and push them off to be analyzed.
### Azure IoT Hub
Take in a lot of messages and have them analyzed but it can also communicate back (bi-directional messaging).
### Azure Logic Apps
Create processes in Azure. Easy to use.
### Azure SignalR Service
Connect clients together in real time and send messages to each other.
## Different Types of Messages
### Intent
#### Command
Services: Storage Queues, Service Bus, IoT Hub, Logic Apps, SignalR
- You want something to happen
- Could get a message back
- Increase temperature on thermostat
### Facts
#### Discrete data
Services: Event Grid, SignalR, Notification Hubs
- Does not happen continually
- Door open / closed
#### Stream of data
Services: Event Hub, IoT Hub
- Continuous stream of data
- Data is related to each other
- Temperature data
## Summary
Subscribe to:
Posts (Atom)