Monday, 13 April 2020
Getting Started with Stackdriver
## Objectives
- View the load on a VM instance using Cloud Monitoring.
## Prerequisites
- Existing GCP Project
- Existing VM instance
## View the Load on a VM using Cloud Monitoring
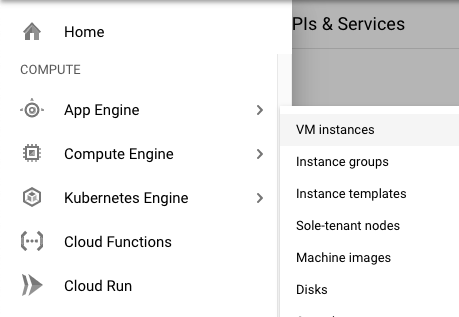
In the GCP Console, on the Navigation menu (Navigation menu), click Compute Engine > VM instances.
To open a command prompt on the my-vm instance, click SSH in its row in the VM instances list.
In the ssh session on my-vm, execute this command to create a CPU load:
```
dd if=/dev/urandom | gzip -9 >> /dev/null &
```
This Linux pipeline forces the CPU to work on compressing a continuous stream of random data.
Leave the window containing your SSH session open.
## Create a Monitoring workspace
You will now setup a Monitoring workspace that's tied to your GCP Project. The following steps create a new account that has a free trial of Monitoring.
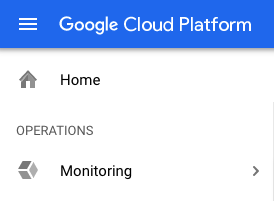
In the Google Cloud Platform Console, click on Navigation menu > Monitoring.
Wait for your workspace to be provisioned.
When the Monitoring dashboard opens, your workspace is ready.
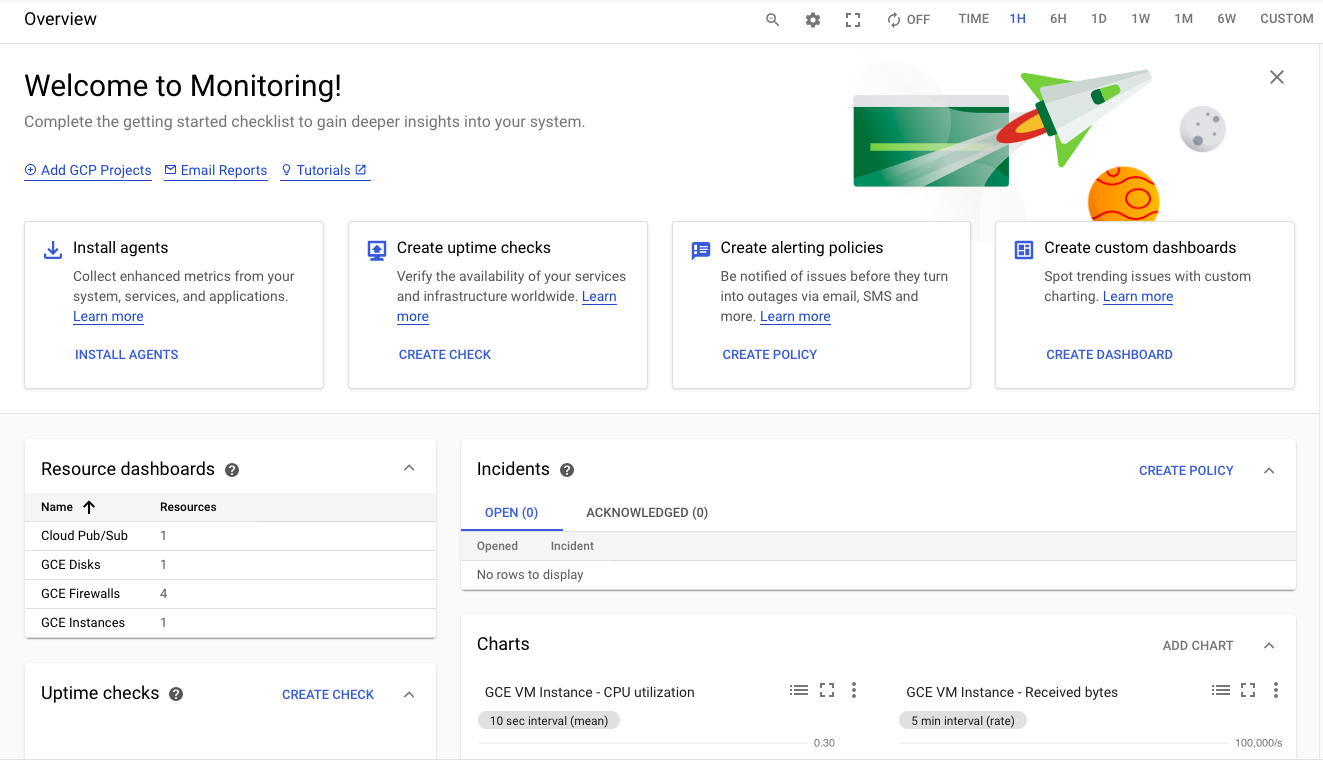
Click on Settings option from the left panel and confirm that the GCP project is shown under the GCP Projects section.
Under the Settings tab menu, click Agent. Using your VM's open SSH window and the code shown on the Agents page, install both the Monitoring and Logging agents on your project's VM.
The monitoring and logging agents give you deeper insight into your infrastructure and application data. Install both agents onto all the infrastructure you want deeper insight into.
### Monitoring agent
The Monitoring agent is a collectd-based daemon that gathers system and application metrics from virtual machine instances and sends them to Monitoring. By default, the Monitoring agent collects disk, CPU, network, and process metrics. Configuring the Monitoring agent allows third-party applications to get the full list of agent metrics.
Monitoring agent install script
```
curl -sSO https://dl.google.com/cloudagents/install-monitoring-agent.sh
sudo bash install-monitoring-agent.sh
```
### Logging Agent
The Logging agent streams logs from your VM instances and from selected third-party software packages to Logging. It is a best practice to run the Logging agent on all your VM instances.
Logging agent install script
```
curl -sSO https://dl.google.com/cloudagents/install-logging-agent.sh
sudo bash install-logging-agent.sh
```
Once both of the agents have been installed on your project's VM, click Metrics Explorer under the main Cloud Monitoring menu on the far left.
In the Metric pane of Metrics Explorer, select the resource type GCE VM instance
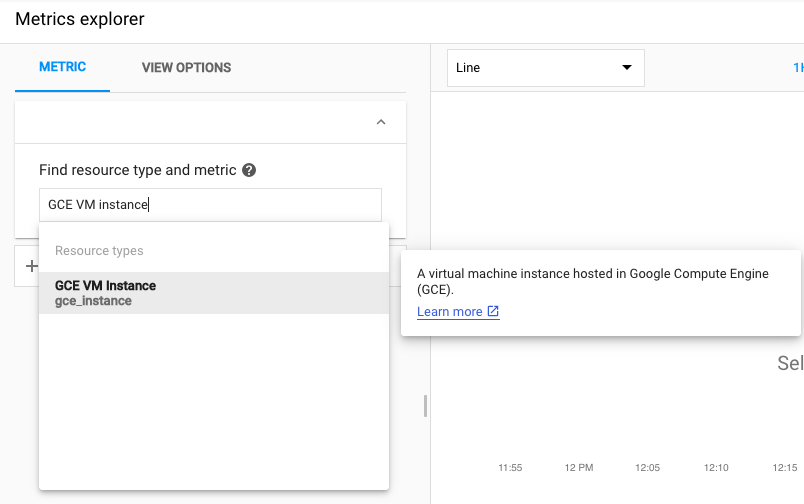
and the metric CPU usage.
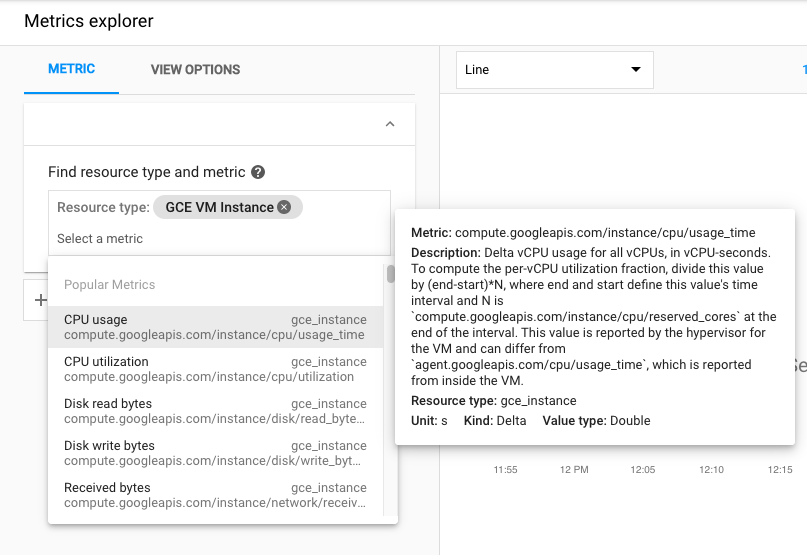
In the resulting graph, notice that CPU usage increased sharply a few minutes ago.
Terminate your workload generator. Return to your ssh session on my-vm and enter this command:
```
kill %1
```
Subscribe to:
Post Comments (Atom)
No comments:
Post a Comment